
Guide
Website traffic drop? How to find the cause and fix it
Why website traffic drops in 2026, from AI Overviews to Google updates, with our own data on each cause and the fix for every one.

· 18 min read
A website traffic drop has one of five causes: broken tracking, falling demand, a technical fault, a Google update, or a results page that answers the search itself. In 2026 I’d suspect the last one first. Below, each cause is shown on a real site, with its fix.
✅ My advice Change nothing until you’ve ruled out the fast causes. Rewriting pages fixes neither a broken tag, the season nor an AI Overview, and it muddies every comparison you make afterwards. Compare full weeks, and the same weeks last year.
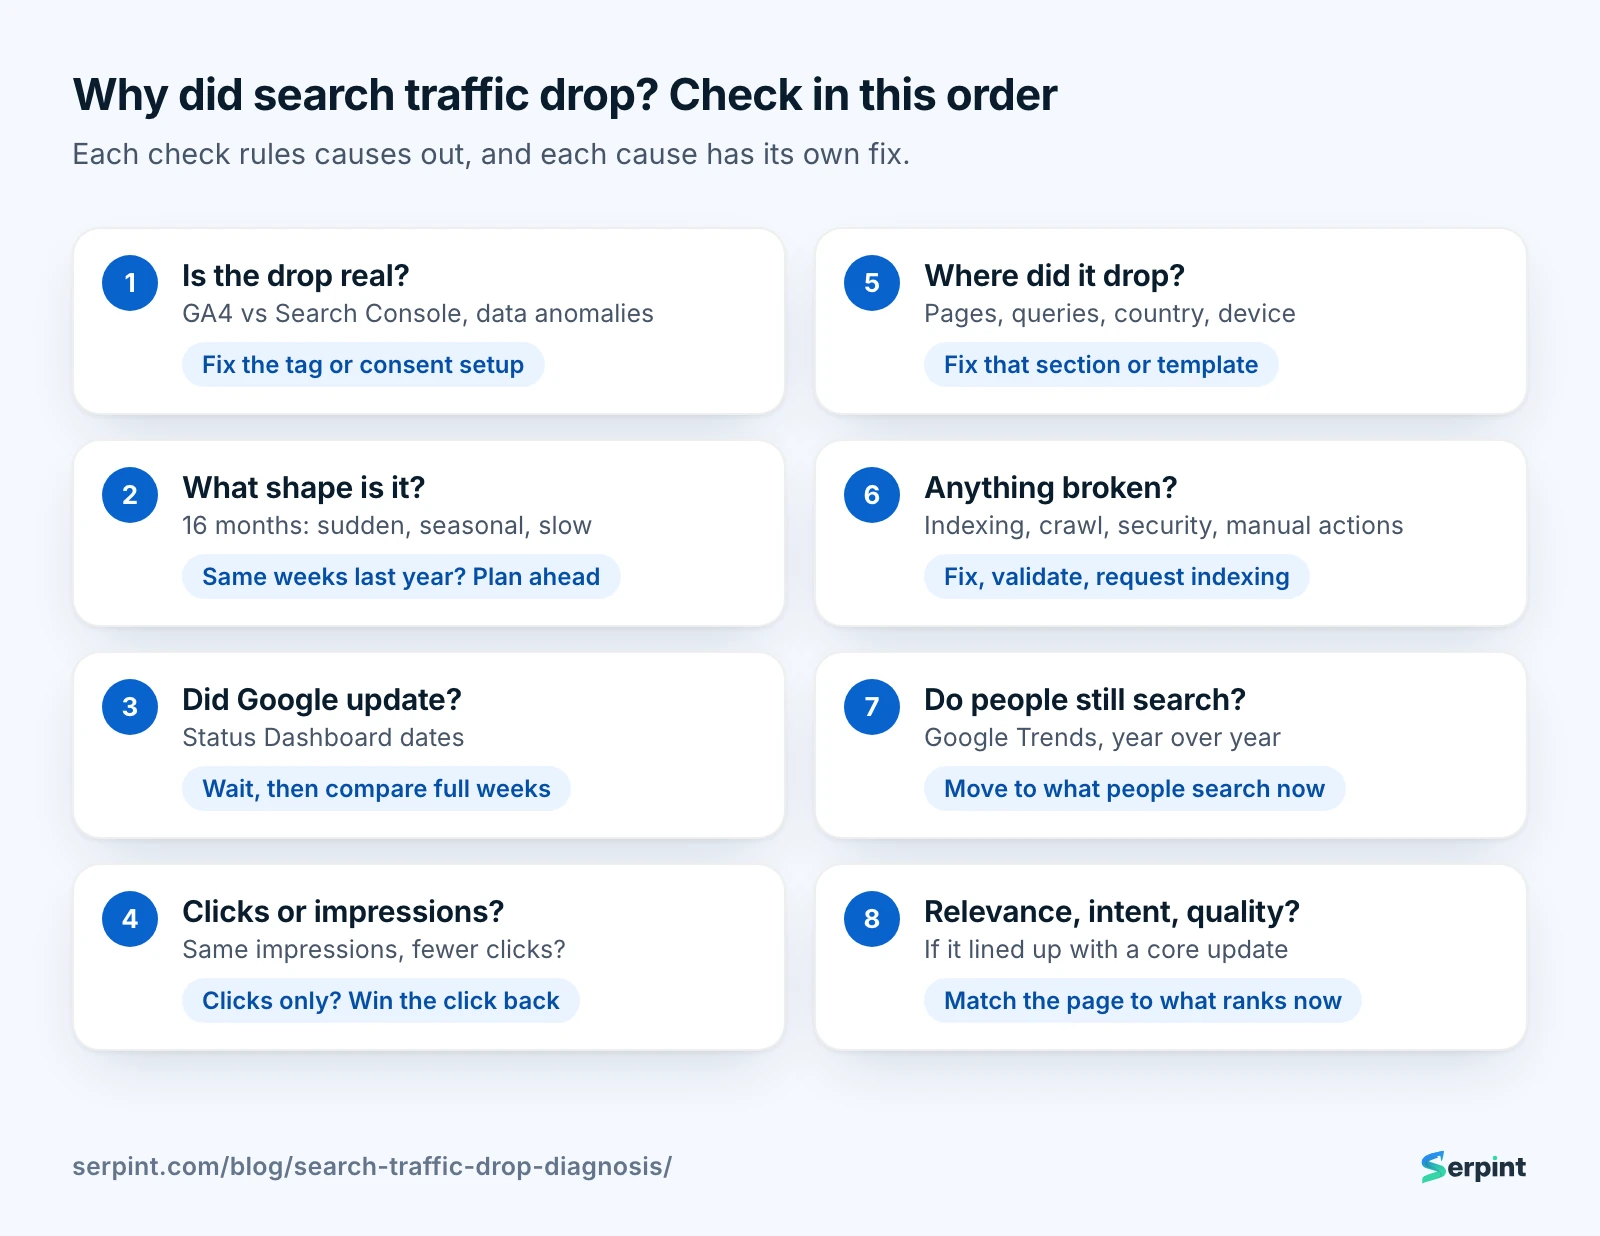
Each check rules causes out, and each cause has its own fix.
You’ll need the site’s Search Console property, and GA4 helps with the first check. The table is the short version.
Which cause fits what you see, and what fixes it?
Most drops show their cause in two or three signals, and each cause has a different first fix. The table matches them up.
| What you see | Likely cause | First fix |
|---|---|---|
| GA4 fell, Search Console didn’t | Tracking or consent change | Repair the tag or consent setup |
| Same dip last year | Seasonal demand | Nothing now; publish earlier next year |
| Rankings held, clicks fell | An AI Overview or other results-page feature | Win the click back (below) |
| Sharp site-wide fall during a rollout | Google update | Wait, then compare full weeks |
| One section or template fell | That section’s pages | Compare its template with what changed |
| Excluded pages jumped | Technical fault | Fix, validate in Search Console, request indexing |
| Fewer people search your topic or name | Falling demand | Cover what people search for now |
| A warning in Search Console | Security issue or manual action | Clean up, then request a review |
The third row is the one most guides skip, and in 2026 it’s the one that hurts most sites.
Why do rankings hold while clicks fall?
Rankings hold while clicks fall because Google answers the search itself, above your result. Its AI Overviews, launched in the US in May 2024, push even the #1 result down the page.
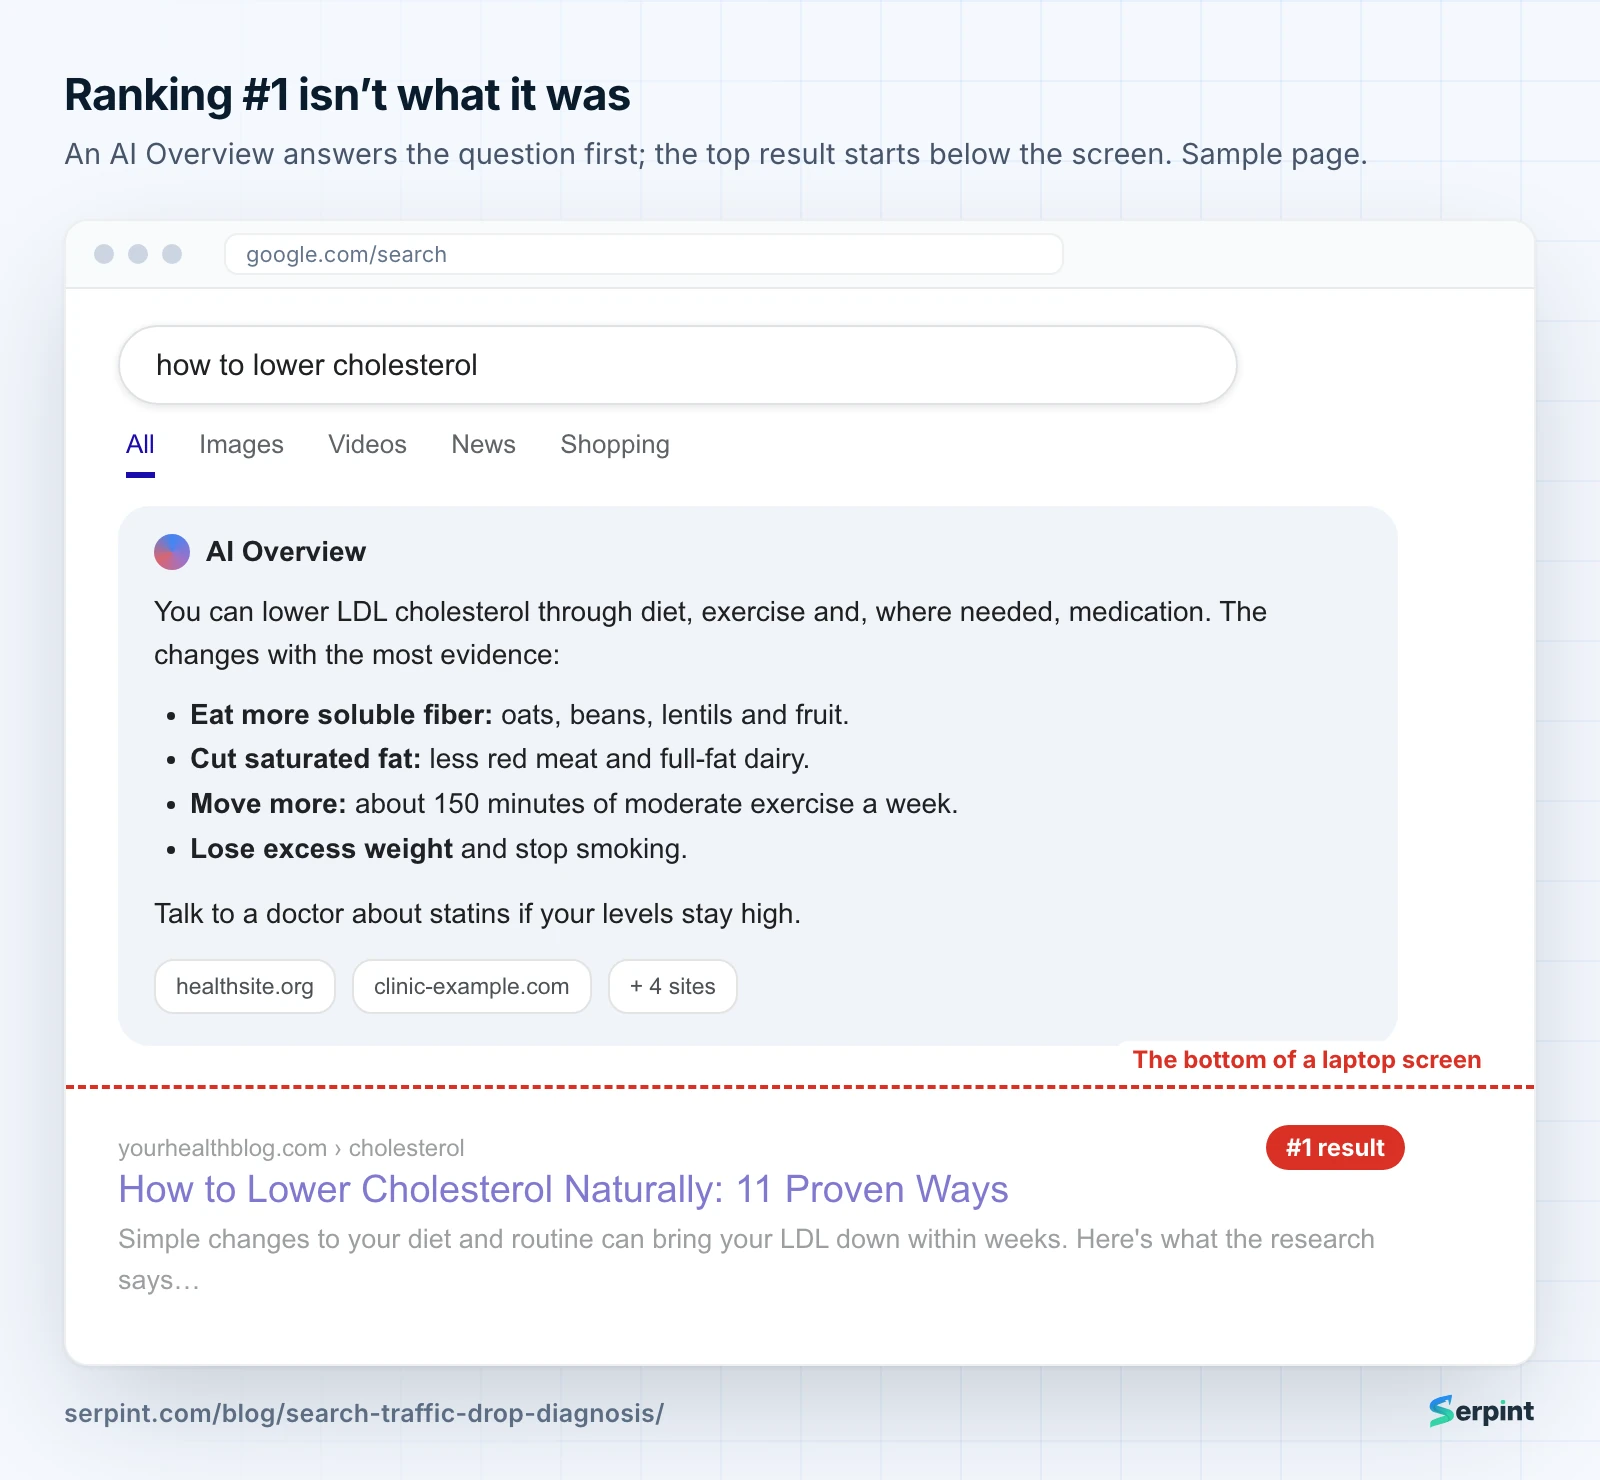
A sample results page: the answer comes first, the #1 result second.
Your report shows the result, not the cause: impressions steady, position unchanged, clicks down. Three studies measured how many clicks that costs.
How many clicks do AI Overviews take?
AI Overviews take about half the clicks a result would otherwise get, and more at the top. In Pew’s browsing data from March 2025, people clicked a result on 15% of searches without a summary and 8% with one.
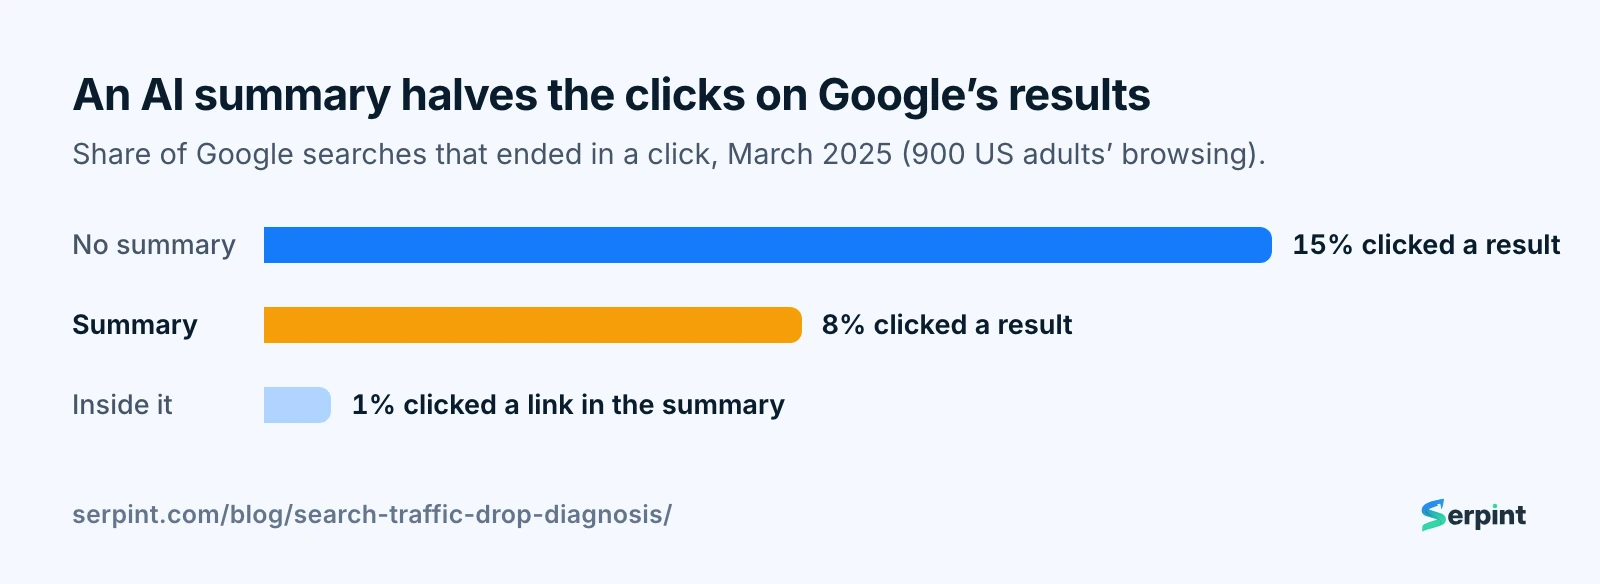
Data: Pew Research Center, 900 US adults’ browsing, March 2025.
Only 1% clicked a link inside the summary itself. So being one of its sources is worth something, but far less than a click on a result used to be.
Ahrefs’ study of 300,000 keywords shows where the loss lands. With an AI Overview, the #1 result’s click rate is 58% lower, #2’s 51% lower, and #10’s only 19% lower.
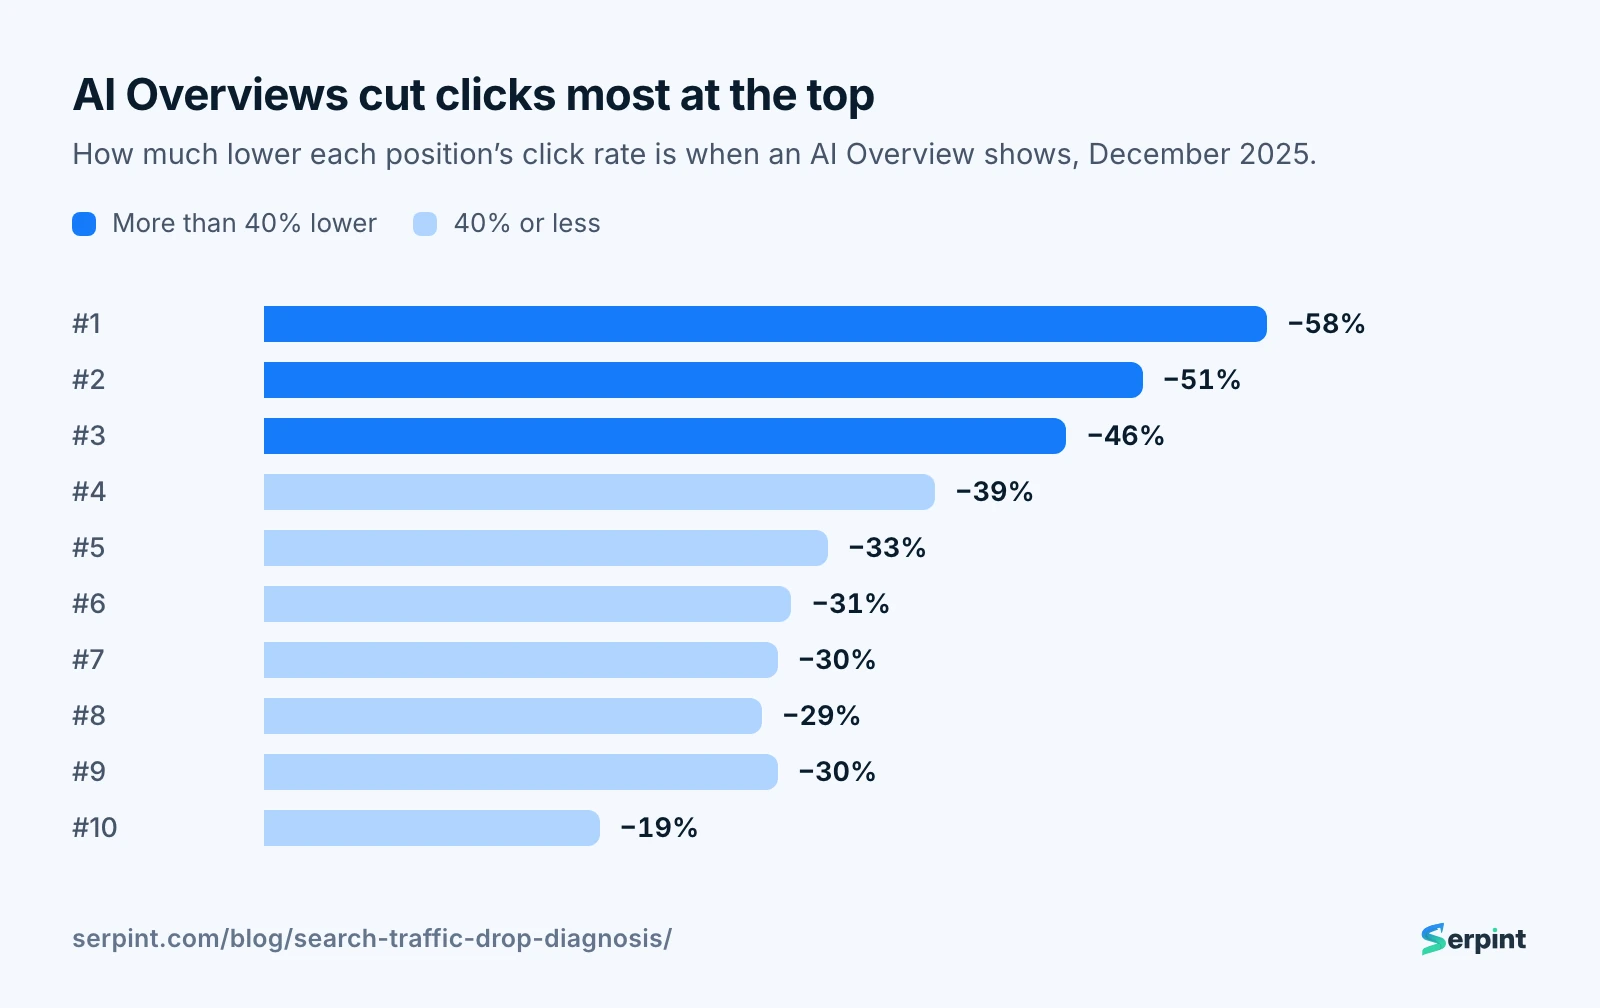
Data: Ahrefs, 300,000 keywords, December 2023 against December 2025.
The top three spots lose the most because they had the most to lose. That changes what a #1 ranking is worth, and it’s why a site can keep every position and still lose a third of its traffic.
Seer’s data adds the trend. On 3,119 informational searches, the organic click rate fell from 1.76% to 0.61% where an overview showed. It fell where none showed too, from 2.74% to 1.62%.
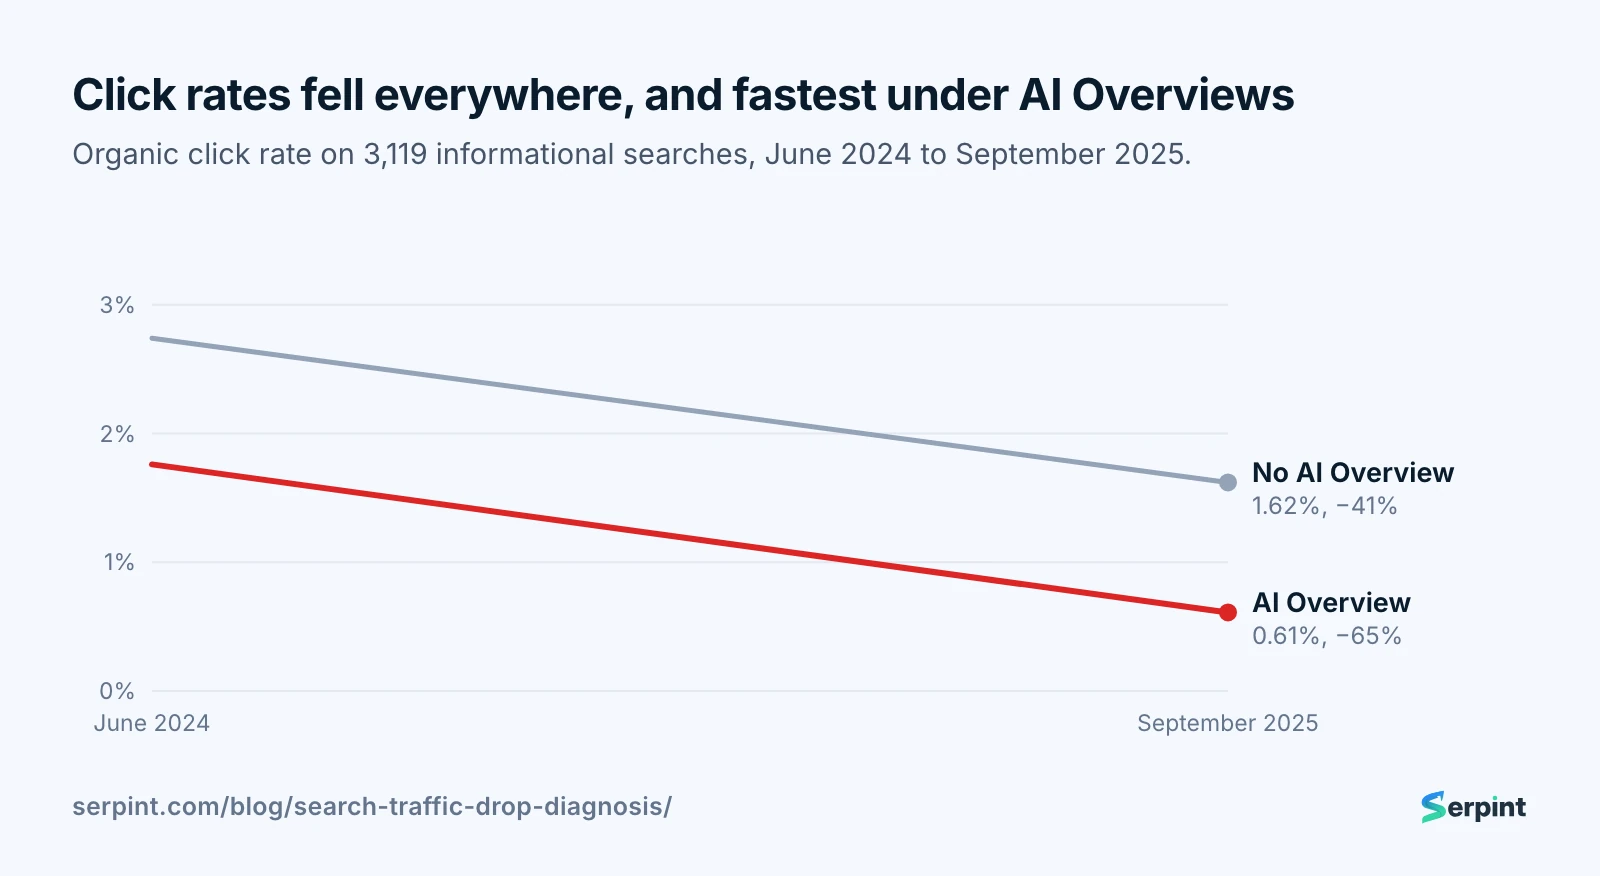
Data: Seer Interactive, 3,119 informational searches across 42 organizations.
Google disagrees with all three. Its head of Search wrote in August 2025 that total clicks to websites are “relatively stable” and of higher quality, but published no numbers. I’d trust your own Search Console over Google’s claim and over any study, including the ones above.
Which searches show an AI Overview?
AI Overviews now show on most searches except local ones. We checked 40 US searches through Serpint’s results-page data on November 11, 2026, ten of each kind. Every how-to search had one, and so did 9 of 10 “best” searches.
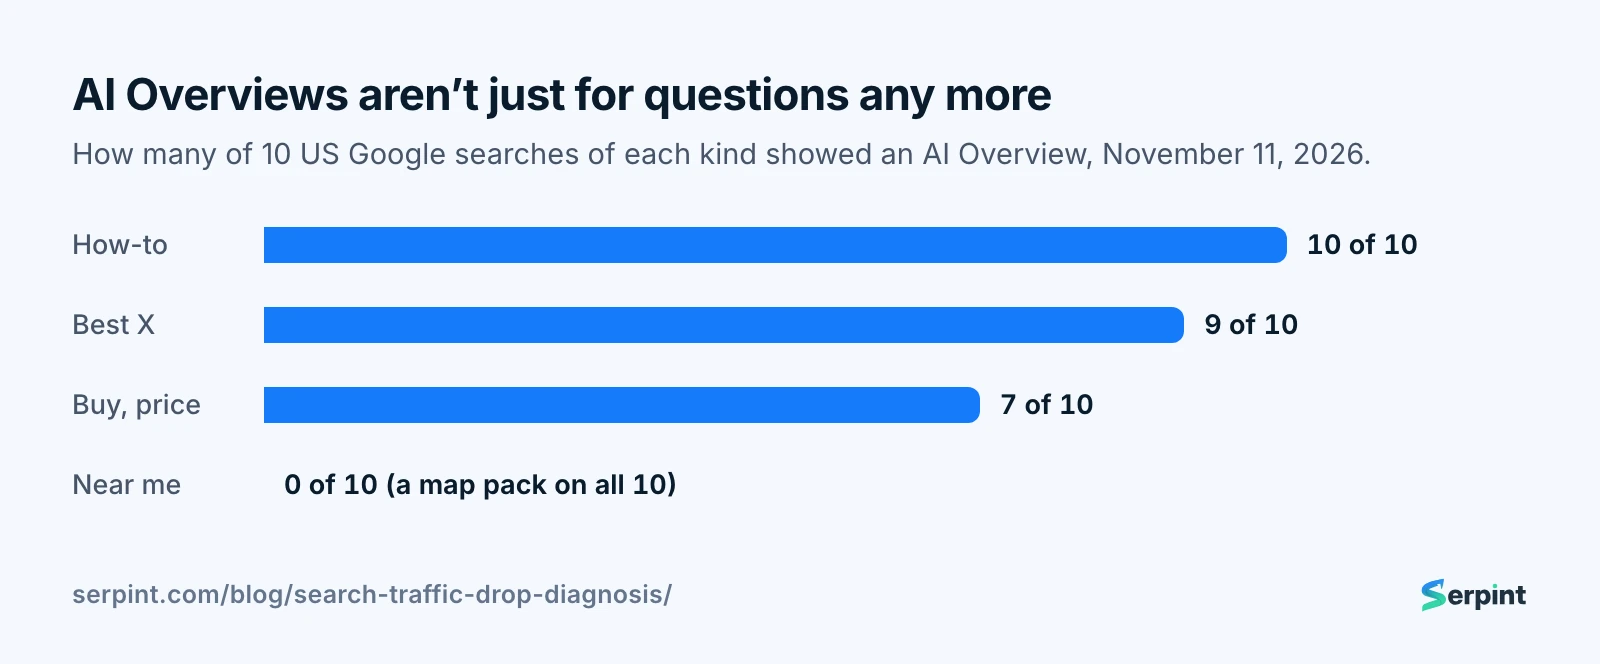
Data: Serpint’s results-page data, 40 US searches, November 11, 2026.
Even 7 of 10 price and buying searches showed an overview, from “iphone 17 price” to “car insurance quote”. None of the 10 “near me” searches did; a map pack showed on all of them. Forty searches is a snapshot, not a census, but the direction is clear.
💡 My take AI Overviews have moved past questions. They sat on 9 of 10 “best” searches in our check, where affiliate and review sites earn, so I’d expect those sites to feel it next. Traffic estimates can’t see it, ours included; only your Search Console shows the clicks you lost.
How do you win clicks back from AI Overviews?
You win clicks back by finding the searches you lost to overviews, then getting cited or giving people a reason to click. Five steps, in order.
Step 1: find the searches. In Search Console’s Performance report, open Queries and compare the same weeks this year and last. Look for searches whose position barely moved but whose click rate fell by a third or more.
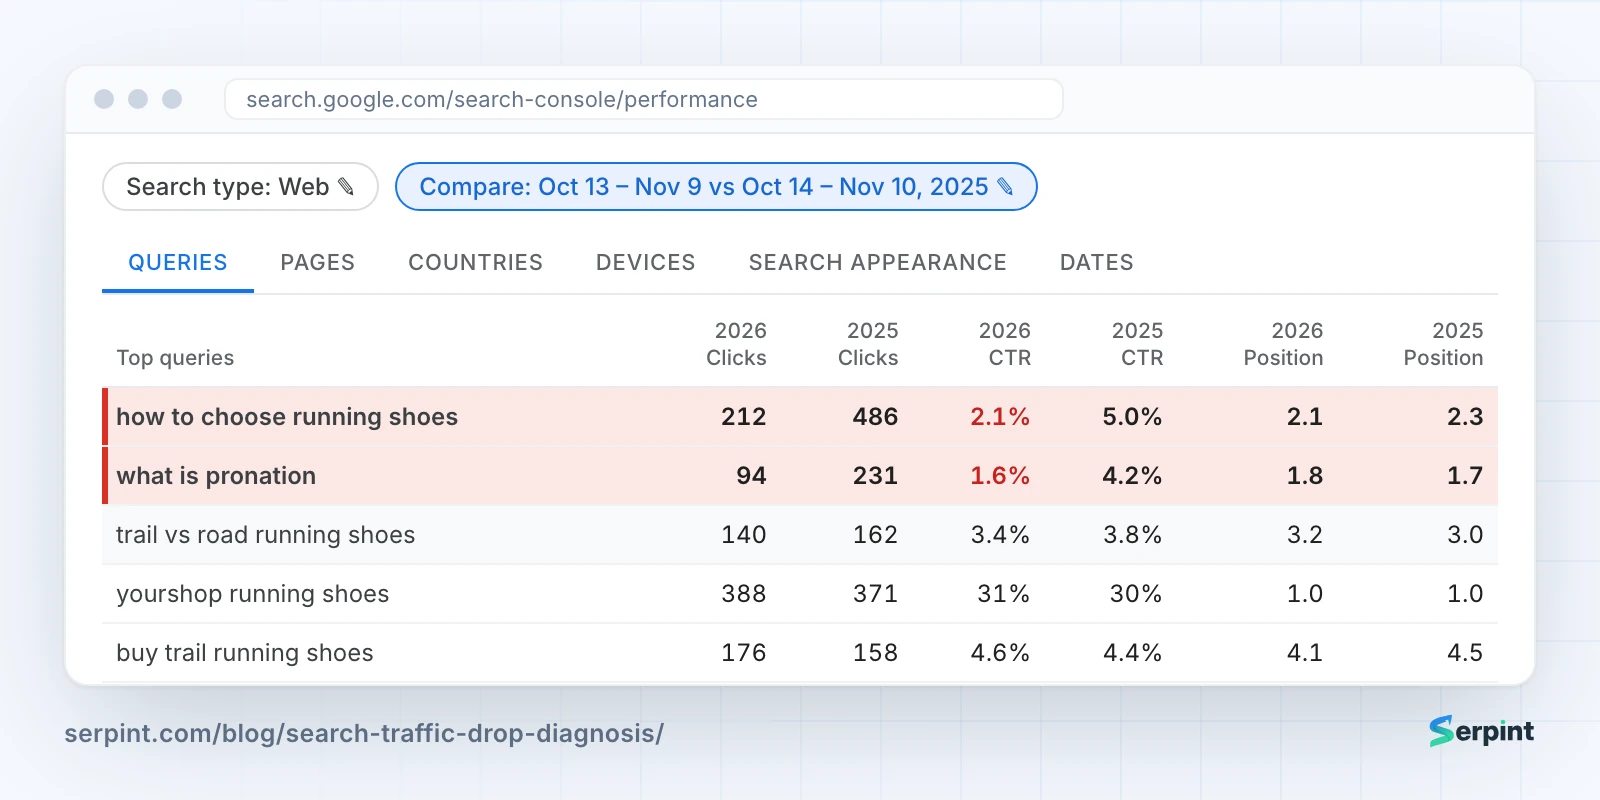
Step 1: same position, half the click rate. Redrawn with sample data.
Step 2: confirm the overview. Search those queries yourself, signed out. Since June 2026, Search Console also has a Generative AI report listing which of your pages appear in AI Overviews and AI Mode. It shows impressions only, no clicks, so pair it with the main report.
Step 3: get cited. In Seer’s data, sites cited in the overview got 0.70% of clicks against 0.52% when not cited, a third more. Google says there’s no special optimization for it: the page must be indexed and able to show a snippet.
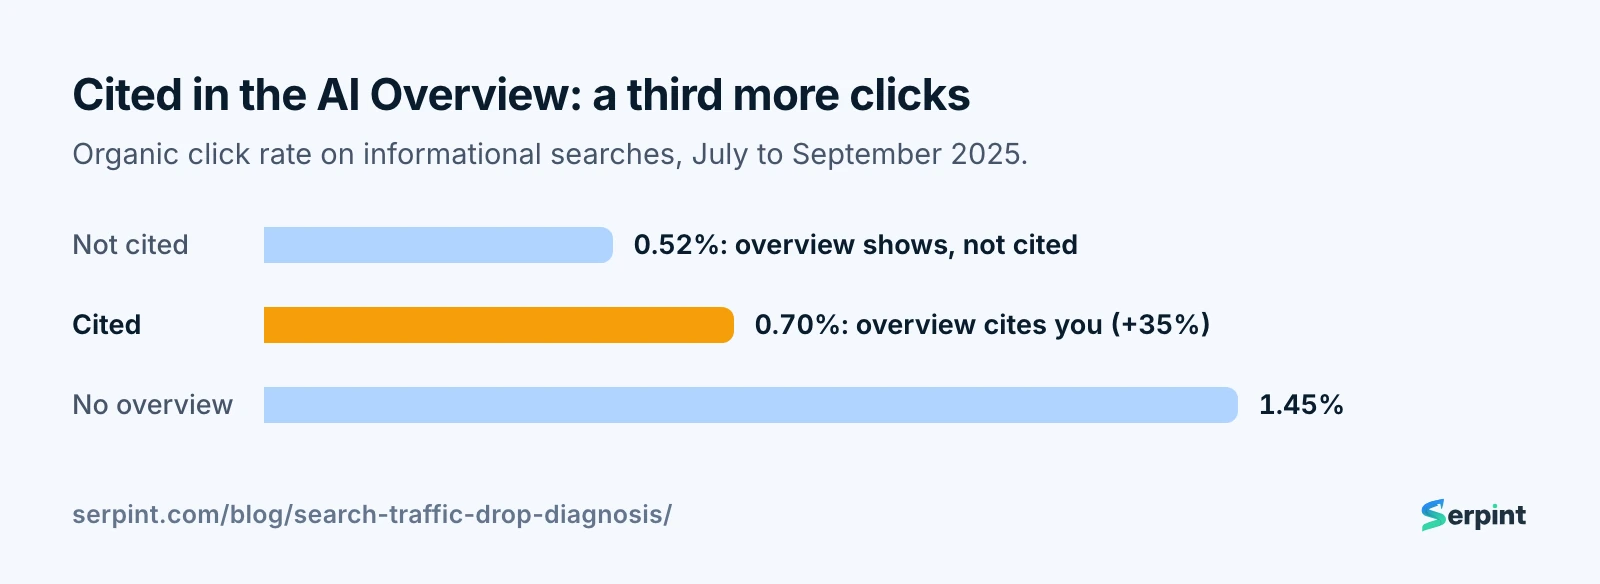
Data: Seer Interactive, July to September 2025.
What I’d do: answer the exact question in the first two sentences under a heading that asks it, with a specific number or name. Summaries quote pages that say the thing plainly.
Step 4: give a reason to click. A summary can’t run a calculator, show your test photos, hand over a template or compare 12 products in a table. Add the thing only a visit gets, then rewrite the title and description to promise it.
Step 5: move your effort. Rank your keyword list by the clicks a search can still send, not by your position. A #3 on a search with no overview can beat a #1 under one. In our check, local and some buying searches were still clear.
✅ My advice Don’t opt out of AI Overviews with nosnippet. It removes your snippet from every Google result, not just the overview, and the clicks you lost don’t come back. Earn the citation and the click instead.
The results page is one cause. Three more show up clearly in our data, starting with the season.
What does a seasonal drop look like, and what do you do?
A seasonal drop looks like a cliff, and the fix is planning, not repair. US searches for “halloween costumes” fell from 16.6 million in October 2025 to 550,000 in November, down 97%.
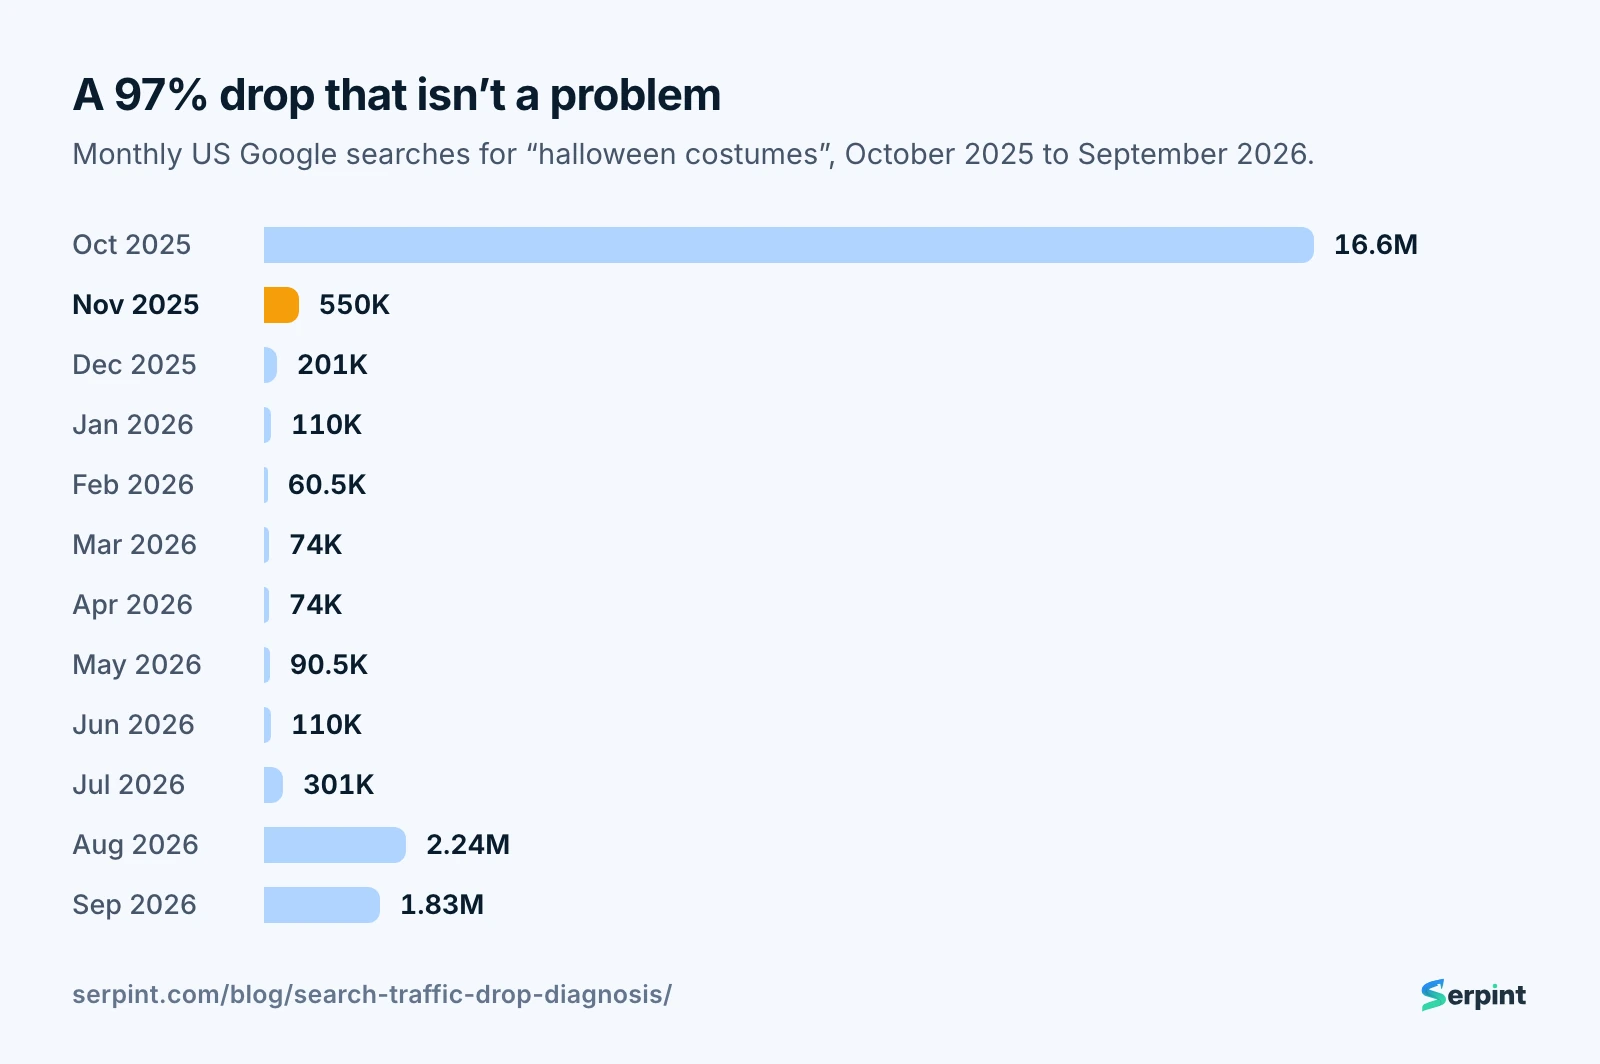
Data: Serpint’s keyword data, US.
A costume shop looking at November alone sees a disaster. Against the November before, it’s an ordinary year. Searches start climbing in July (301,000) and jump in August (2.24 million), long before the shop’s peak.
The fix is timing. Publish or refresh seasonal pages about two months before searches climb, so Google has crawled and ranked them by the rise. Keep the same URL every year and update the year in it, so its links and history carry over. Never redirect a seasonal page away after the season.
What does falling demand look like, and what do you do?
Falling demand looks like a slow loss with rankings intact, and no on-page fix touches it. Chegg is the clearest case I’ve found: searches for its own name fell from 246,000 a month in October 2025 to 165,000 in September 2026.
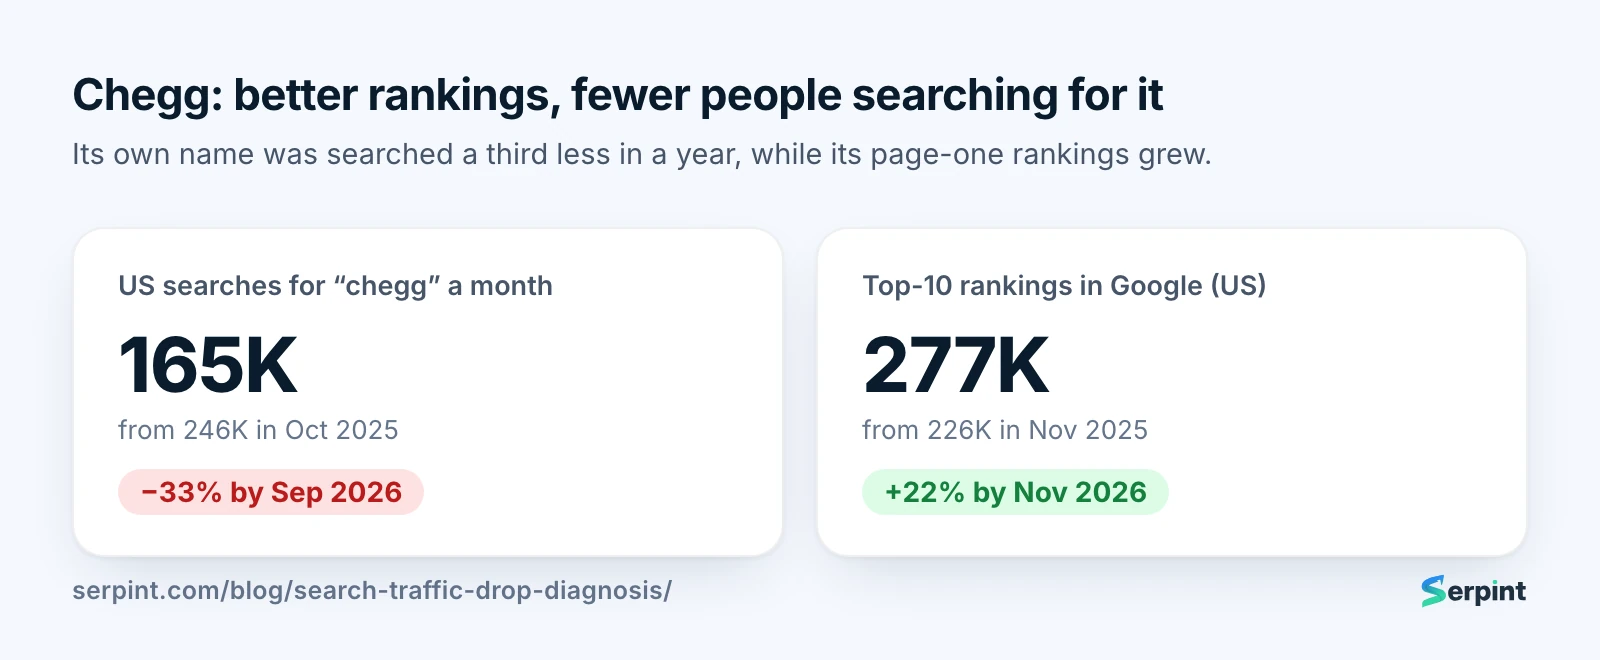
Data: Serpint’s keyword and ranking data, US.
Over the same year, Chegg’s top-10 rankings grew 22%, from 226,000 to 277,000. Google didn’t push it down; fewer students went looking for it. Chegg sued Google in February 2025, blaming AI Overviews for a 49% fall in its non-subscriber traffic.
The fix is to follow the demand. Look at what people search instead: newer terms, related questions, AI assistants (GA4 shows visits from ChatGPT and the others). Build pages for those. When demand for your own name falls, that’s a product problem, and no rewrite will fix it.
What does a Google update drop look like, and what do you do?
A Google update drop is a step, not a slope, and the fix starts with waiting. Stack Exchange’s top-10 rankings fell 14% in one month, from 3.09 million in our March snapshot to 2.67 million in April, across the March 2026 core update.
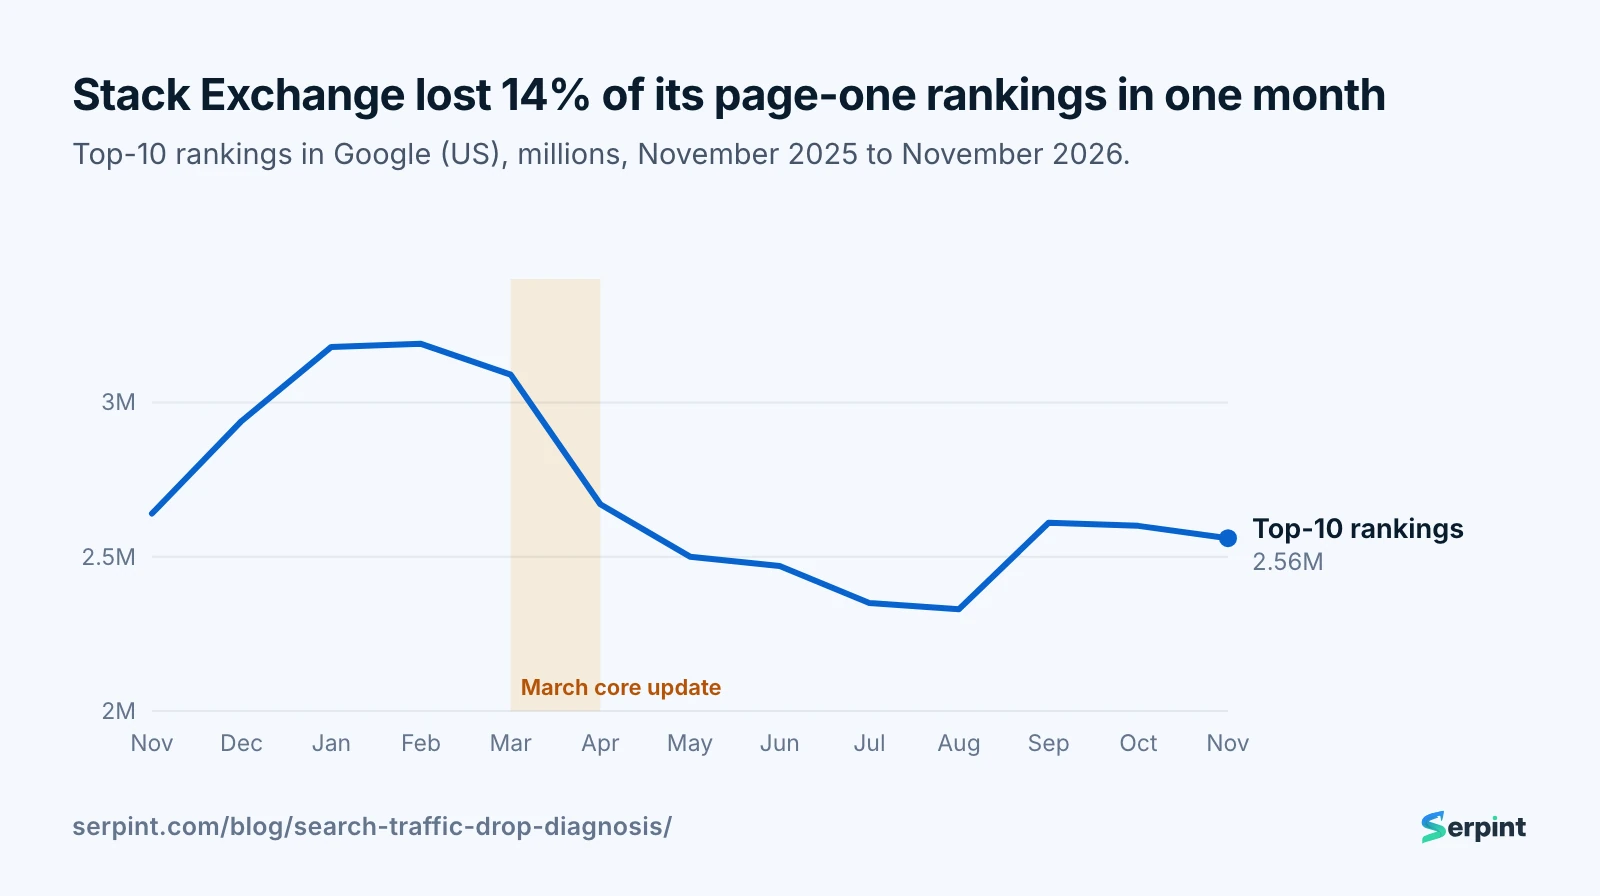
Data: Serpint’s ranking data, Google US, monthly.
The slide kept going until August. Forums and Q&A sites lost ground in both 2026 core updates, while the sites that own the answer held; our November core update post has the pattern. Check 8 below covers what to change once the update has finished.
With the causes in view, here are the checks in order, each with its fix.
1. Is the drop real?
Check first that people stopped coming, not that something stopped counting them. If GA4’s organic sessions fell but Search Console’s clicks didn’t, the problem is measurement.
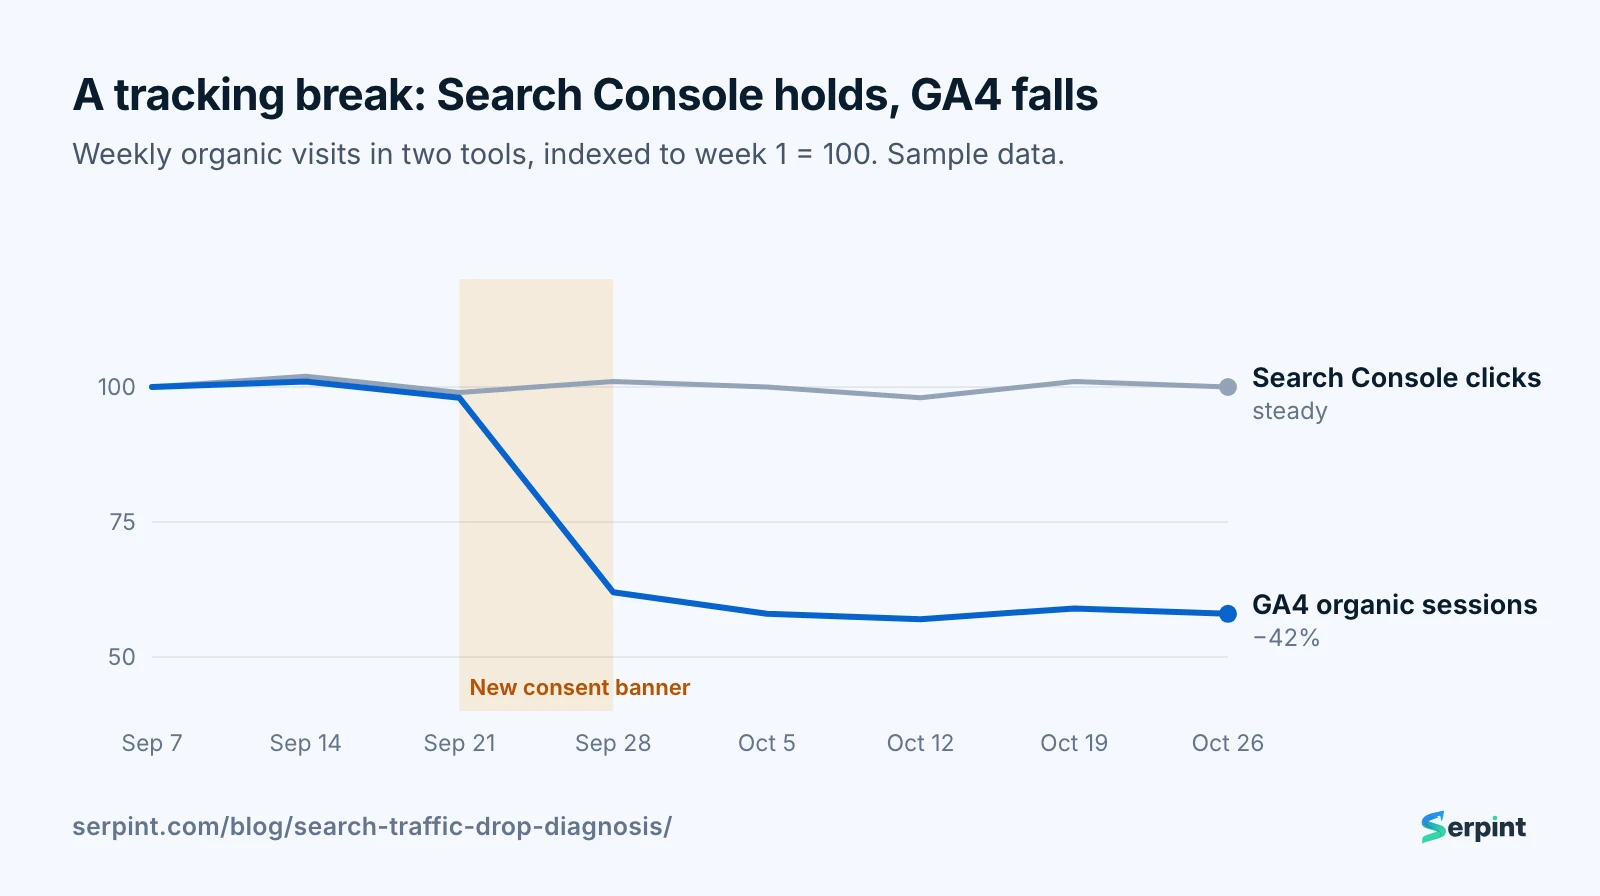
A tracking break, with sample data.
The usual culprits are a tag lost in a redesign, a new consent banner or a filter added to the property. Search Console keeps a data anomalies page for its own logging problems too.
Reporting changes count. Around September 10, 2025, Google stopped showing 100 results on one page. In an analysis of 319 sites, 87.7% lost Search Console impressions and average positions rose. Much of what vanished was tools loading 100 results at once, not people.
The fix: open Tag Assistant and check the GA4 tag fires on every page template, not just the home page. If a consent banner changed, check what analytics does before someone answers it. Lost GA4 data can’t be recovered, so note the date and use Search Console’s clicks for the gap.
2. What shape does the drop have?
The shape of the drop narrows the cause fast. Set Search Console’s Performance report to the last 16 months and look at clicks and impressions together. Google’s debugging guide sketches four patterns.
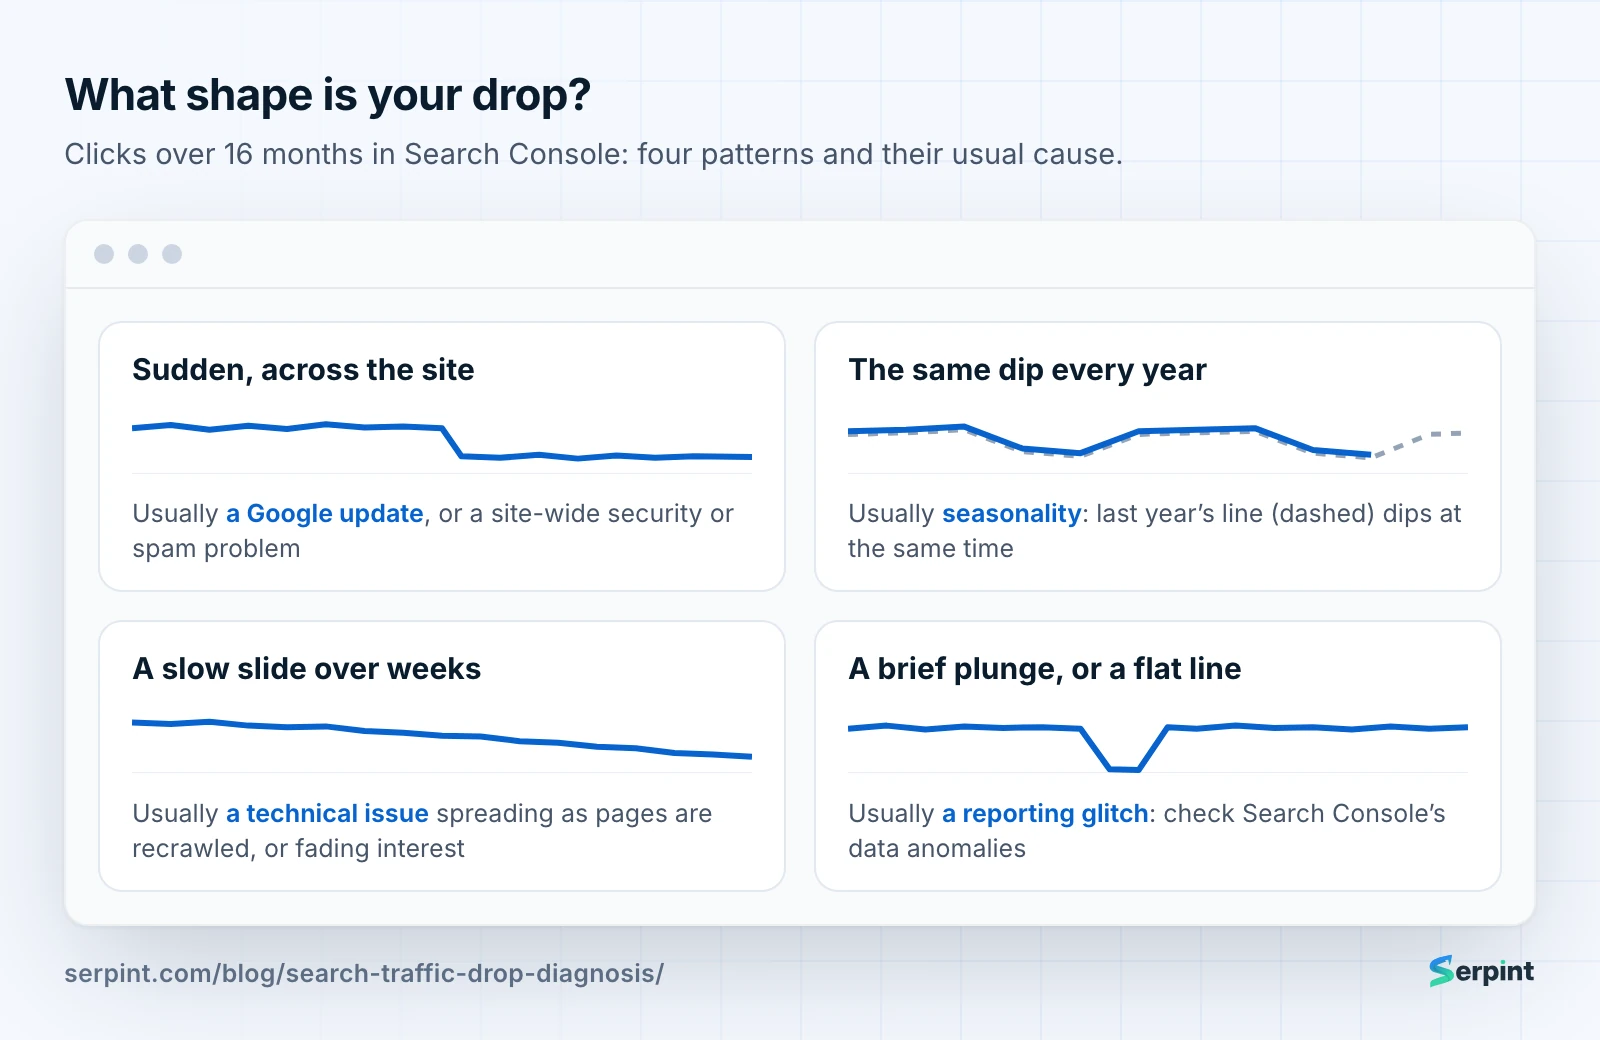
The four patterns in Google’s debugging guide, redrawn.
The fix: none yet; the shape tells you which section above to read. The same dip last year is the season. A step down sends you to the next check. A slow slide usually means a fault spreading or demand fading.
3. Did a Google update start at the same time?
Open Google’s Search Status Dashboard and its list of ranking updates. Note the start and end dates of any update near your drop. This month, the November 2026 core update has been rolling out since November 10.
✅ My advice If the drop began during a rollout, wait for it to finish. Then compare the first full week after it with a week before it started, as Google suggests. Readings taken mid-rollout often reverse.
The fix: after the comparison, a fall of a position or two needs no drastic action. A fall from page one to page three does: go to check 8. A drop that matches no update can still be algorithmic, but work through checks 4 to 7 first.
4. Did clicks fall, or impressions too?
Clicks and impressions tell different stories. Use the date filter’s Compare tab to set the drop period against the four weeks before it, and against the same weeks last year.
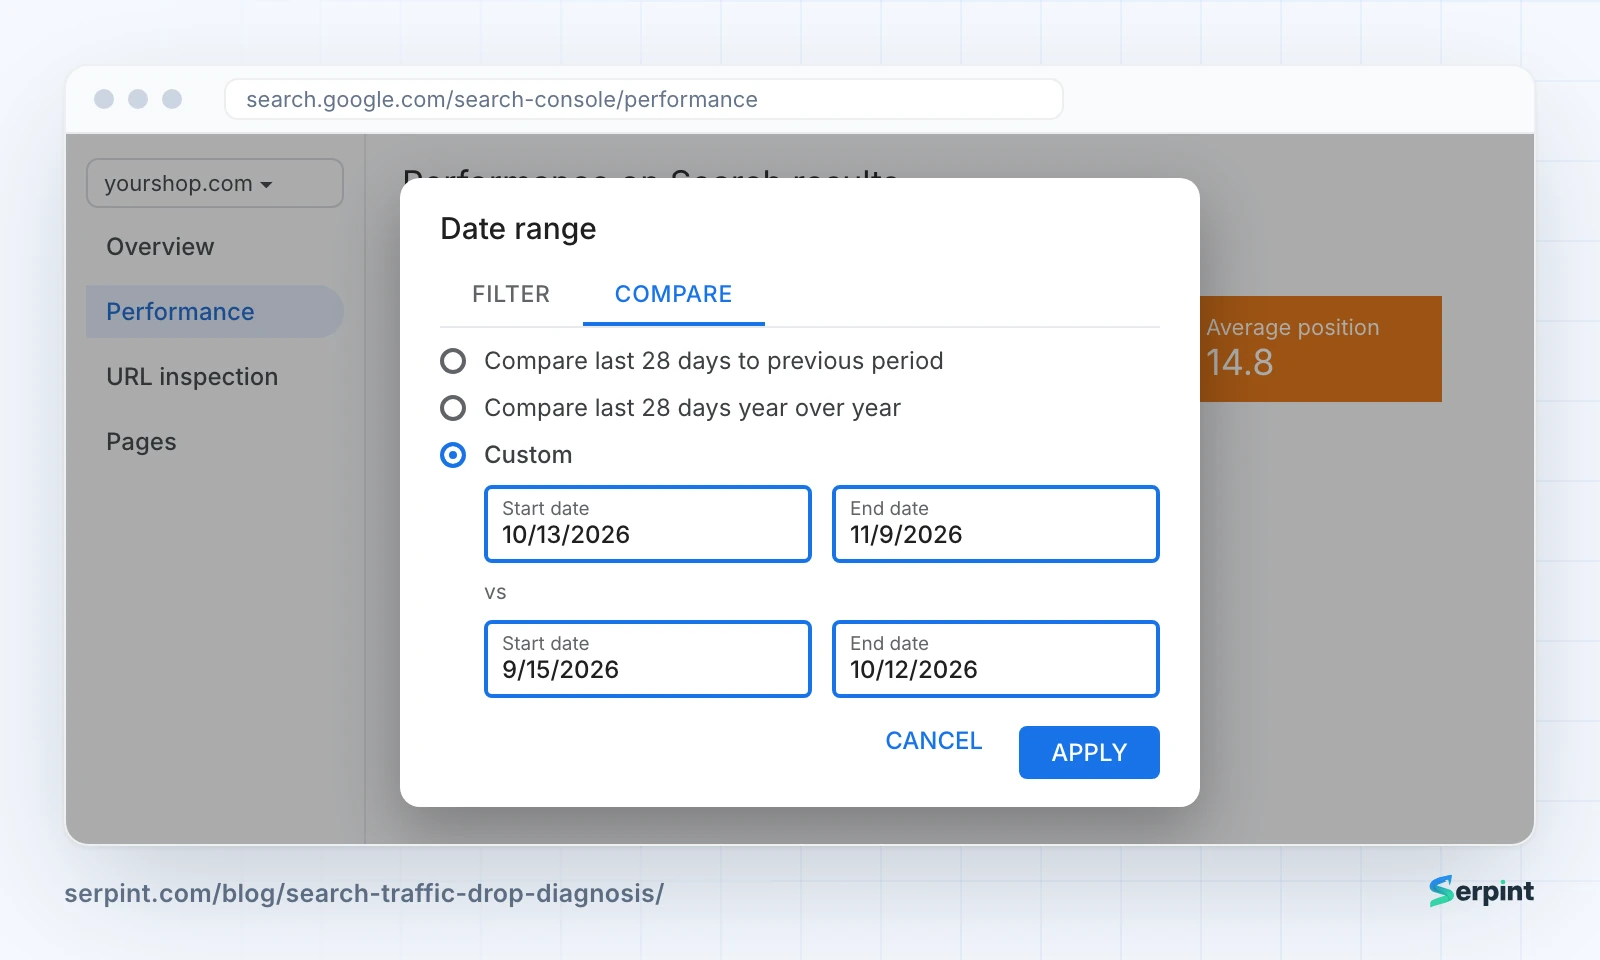
Step 4: the drop period against the four weeks before it. Redrawn with sample data.
If impressions held but clicks fell, you’re still shown but fewer people click. That’s the results page: follow the five steps for winning clicks back above. Also check Search Appearance for rich results you lost, such as review stars or FAQs.
If impressions and clicks both fell, you’re being shown less. That points to rankings, indexing or demand, so find where it happened.
5. Where exactly did traffic drop?
The Pages tab shows where the loss sits. Sort it by the difference in clicks, then ask whether it’s the whole site, one section or one page.
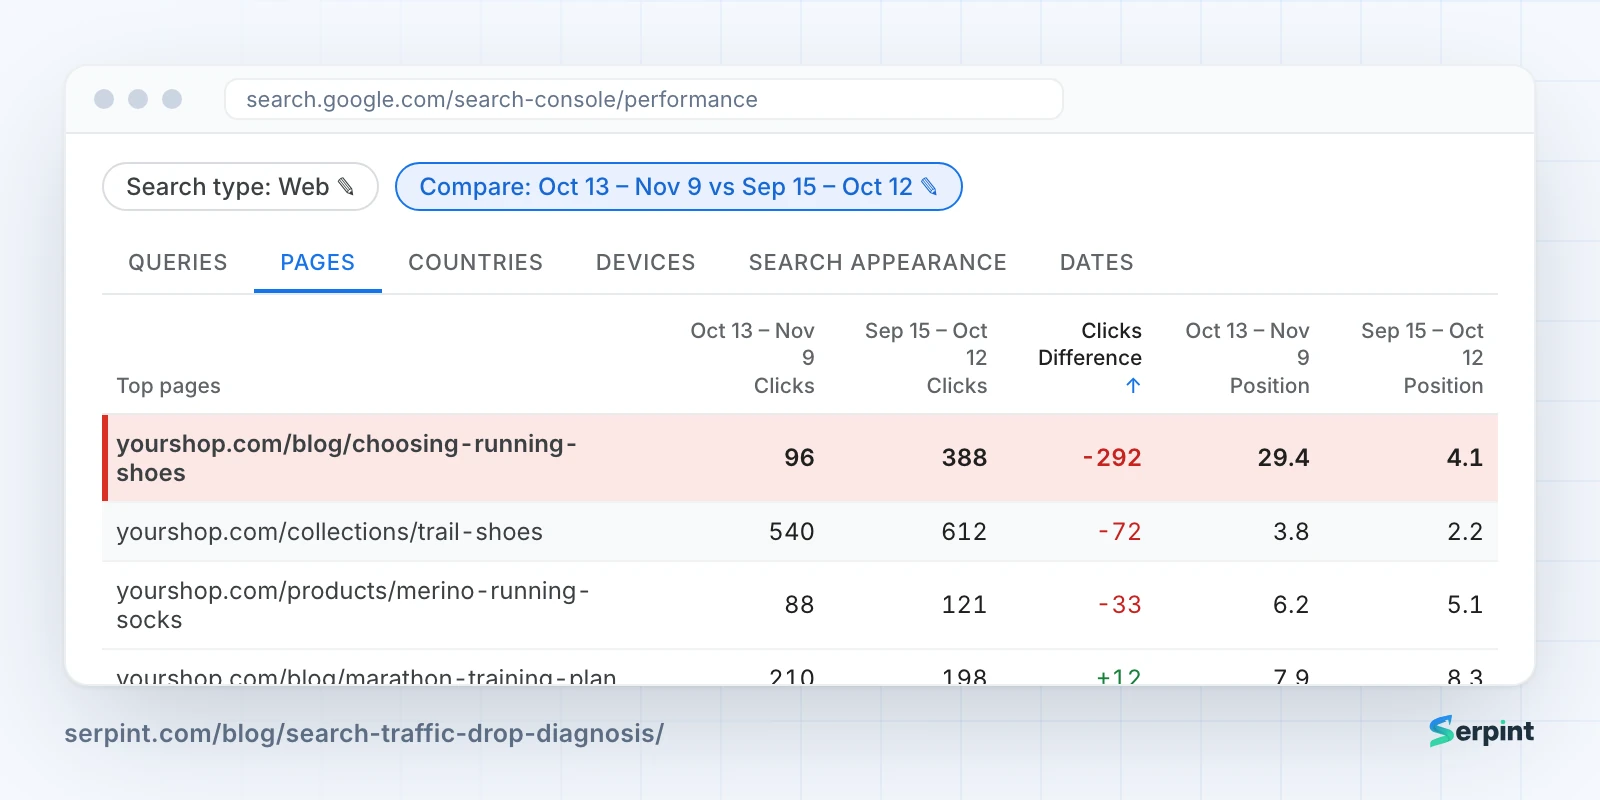
Step 5: the pages that lost the most, first. Redrawn with sample data.
A site-wide drop points to an update, a technical fault or a security problem. One section points to its template. Check the Countries and Devices tabs too: a mobile-only drop can mean a mobile rendering problem.
The fix: for one section, compare its template with what changed on the drop date: a deploy, a plugin, new internal links. Run URL inspection’s live test on one of its pages and read the rendered HTML. For one page, search its main query and see what replaced it.
6. Is something broken on the site?
Technical faults, security problems and manual actions are the quickest causes to fix, so rule them out before judging content. Search Console has a report for each.
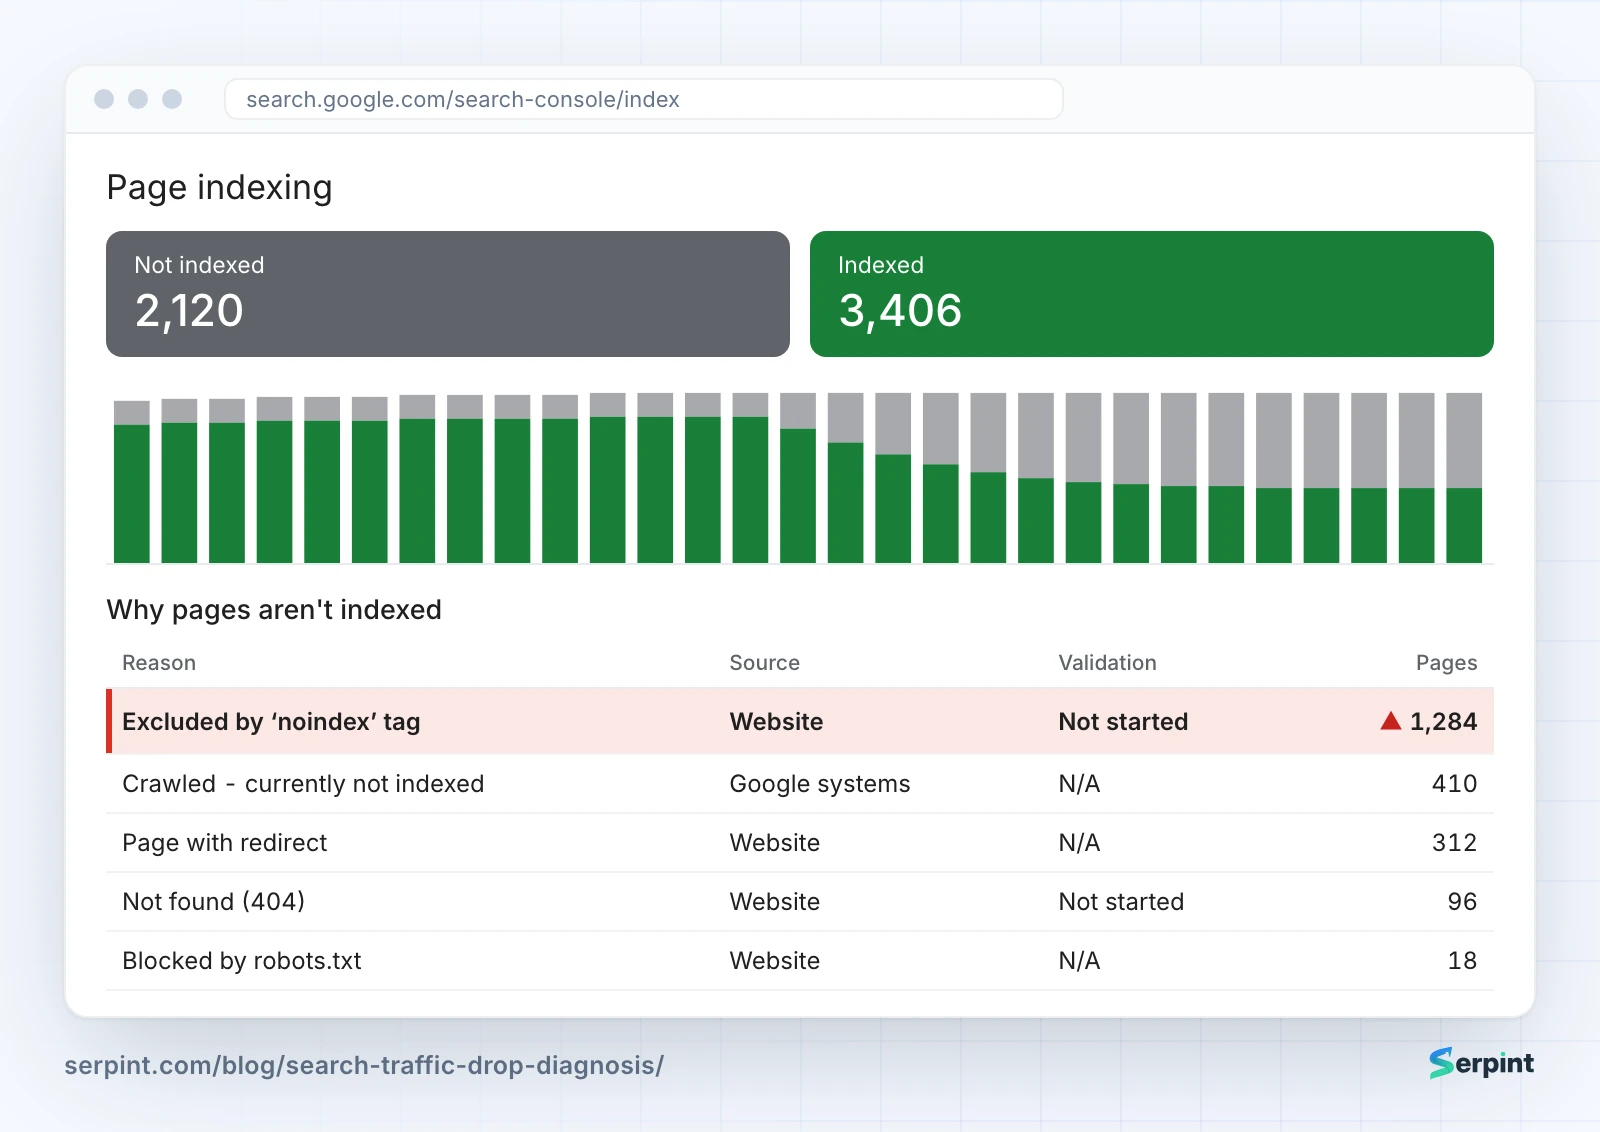
Step 6: a jump in excluded pages, here from a stray noindex tag. Redrawn with sample data.
In Page indexing, look for a jump in excluded pages: noindex, blocked by robots.txt, or not found. In Crawl stats, look for server errors around the drop date. Check Security issues and Manual actions too.
The fix: remove the stray noindex or robots.txt rule, or redirect the old URLs with 301s. Then press Validate fix in Page indexing, request indexing for your top pages and resubmit the sitemap.
For a security issue or manual action, clean up and request a review. After a site move, Google says a medium-sized site can take a few weeks to settle.
7. Do people still search for it?
Demand can fall while your rankings hold, as Chegg’s did. Take your top lost queries to Google Trends, or check their monthly search volumes, for the same period.
The fix: if interest fell everywhere, your rankings didn’t drop; people are searching less, or asking an AI assistant instead. Cover the terms that replaced them. A year-over-year comparison in Search Console confirms which.
8. Was it relevance, intent or quality?
When the drop lines up with a core update and nothing above explains it, work out what kind of change it was. People who work on core update recoveries separate three kinds, and each has a different fix.
Relevance: something newer or more specific now answers the search better. Fix it by updating the page with what’s new and narrowing it to the question people ask.
Intent: Google now shows a different kind of page, such as shops where reviews used to rank. Don’t fight it. Build the kind of page it shows, or aim the page at the searches that still want yours (“X review”, “X vs Y”).
Quality: the site as a whole looks less helpful than what now ranks. Only this calls for site-wide work, so be sure before you start. Merge or remove thin and overlapping pages, add first-hand evidence (tests, photos, numbers), and cut intrusive ads and pop-ups.
Recovery takes time. Google says improvements can take months to show, and sites that dropped hard often recover only at a later core update.
That’s eight checks across Search Console, GA4, Google’s status page and Google Trends, with two date ranges and a page-by-page sort for each. Done by hand, they still won’t tell you whether a drop came from Google or from a change on your own site.
How can Serpint find the cause for you?
Serpint puts the data for all eight checks in one place, for every site you run, with Google’s updates shown next to your own changes.
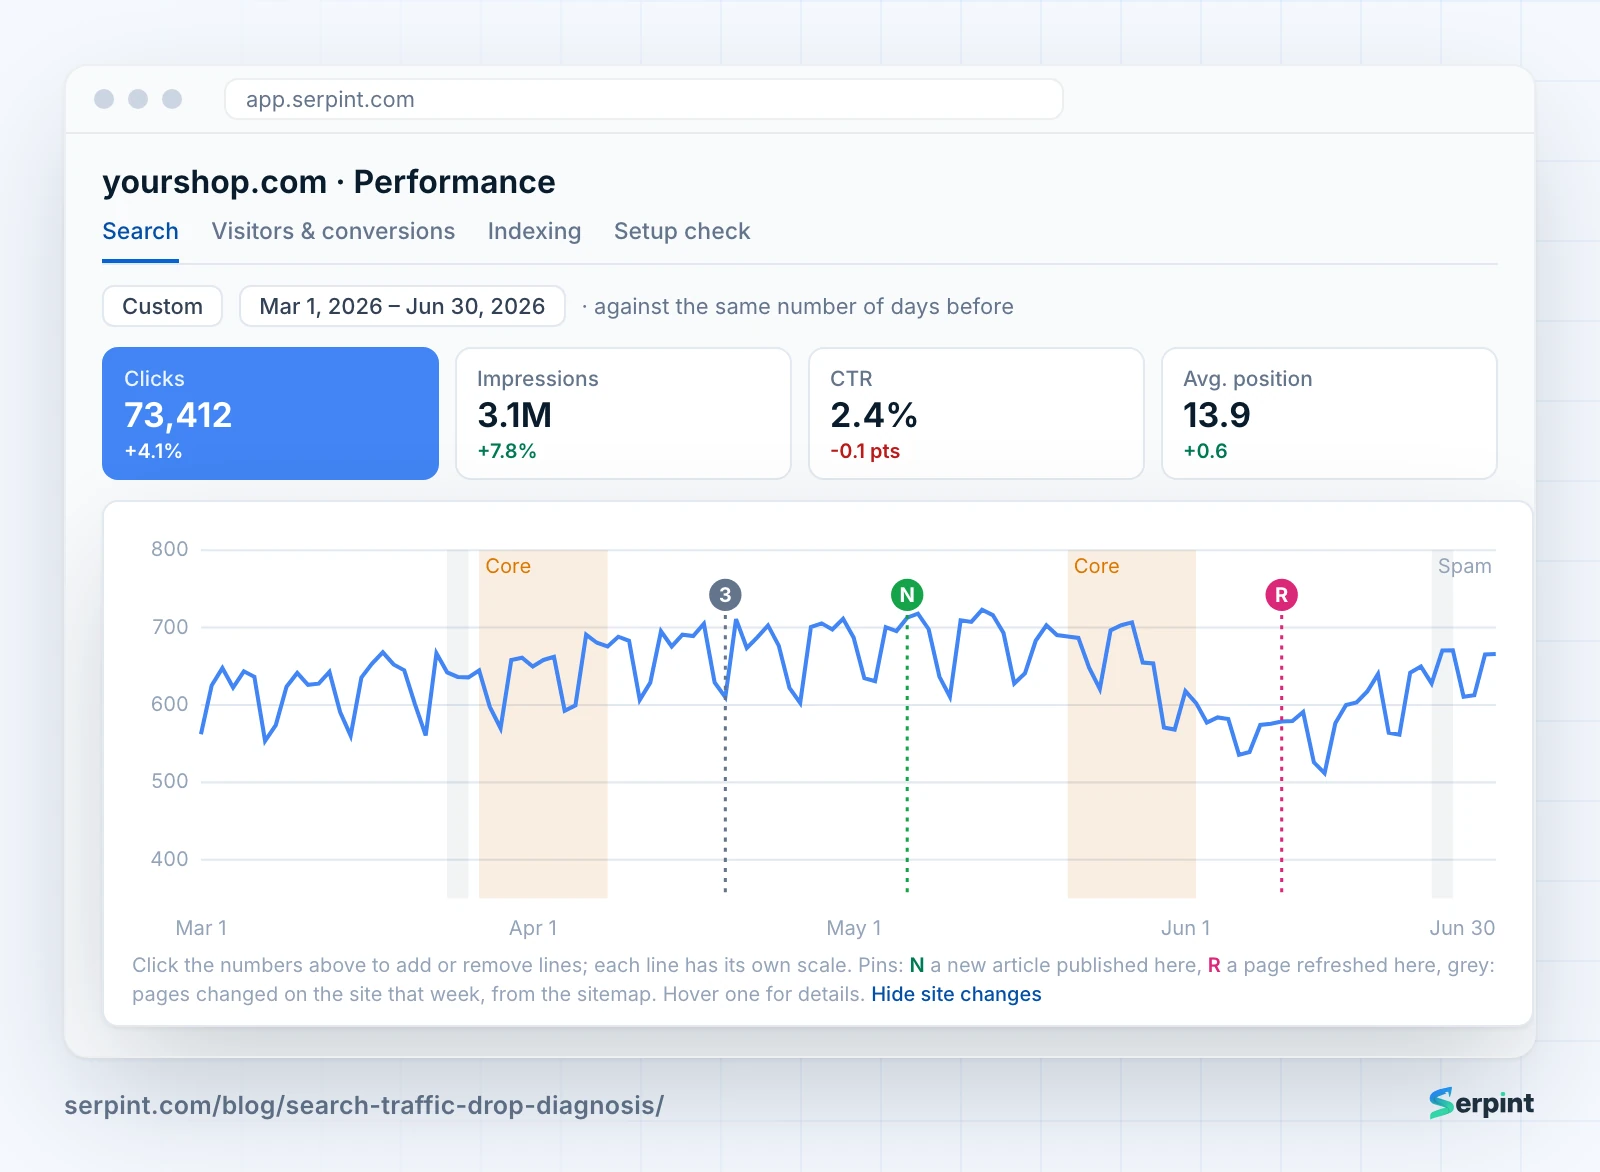
Each check has a place in Serpint:
| Check | Where Serpint answers it |
|---|---|
| 1. Is the drop real? | The setup check compares GA4’s visits with Search Console’s clicks, and checks your tag and sitemap |
| 2. What shape is it? | 16 months of Search Console history on every plan |
| 3. Did Google update? | Every confirmed update shaded on your charts, with a heads-up while one rolls out |
| 4. Clicks or impressions? | Rank tracking shows the results-page features you own and miss, AI Overview citations included |
| 5. Where did it drop? | Opportunities lists the searches slipping away |
| 6. Anything broken? | Important pages checked with Google weekly, a monthly site audit, sitemaps checked daily with an email for new errors |
| 7. Do people still search? | Keyword research with each search’s volume |
| 8. Who took the clicks? | Site explorer, with up to 36 months of any competitor’s traffic |
When an update finishes, Serpint measures how it moved each of your sites against the site’s own trend, and emails you the result.
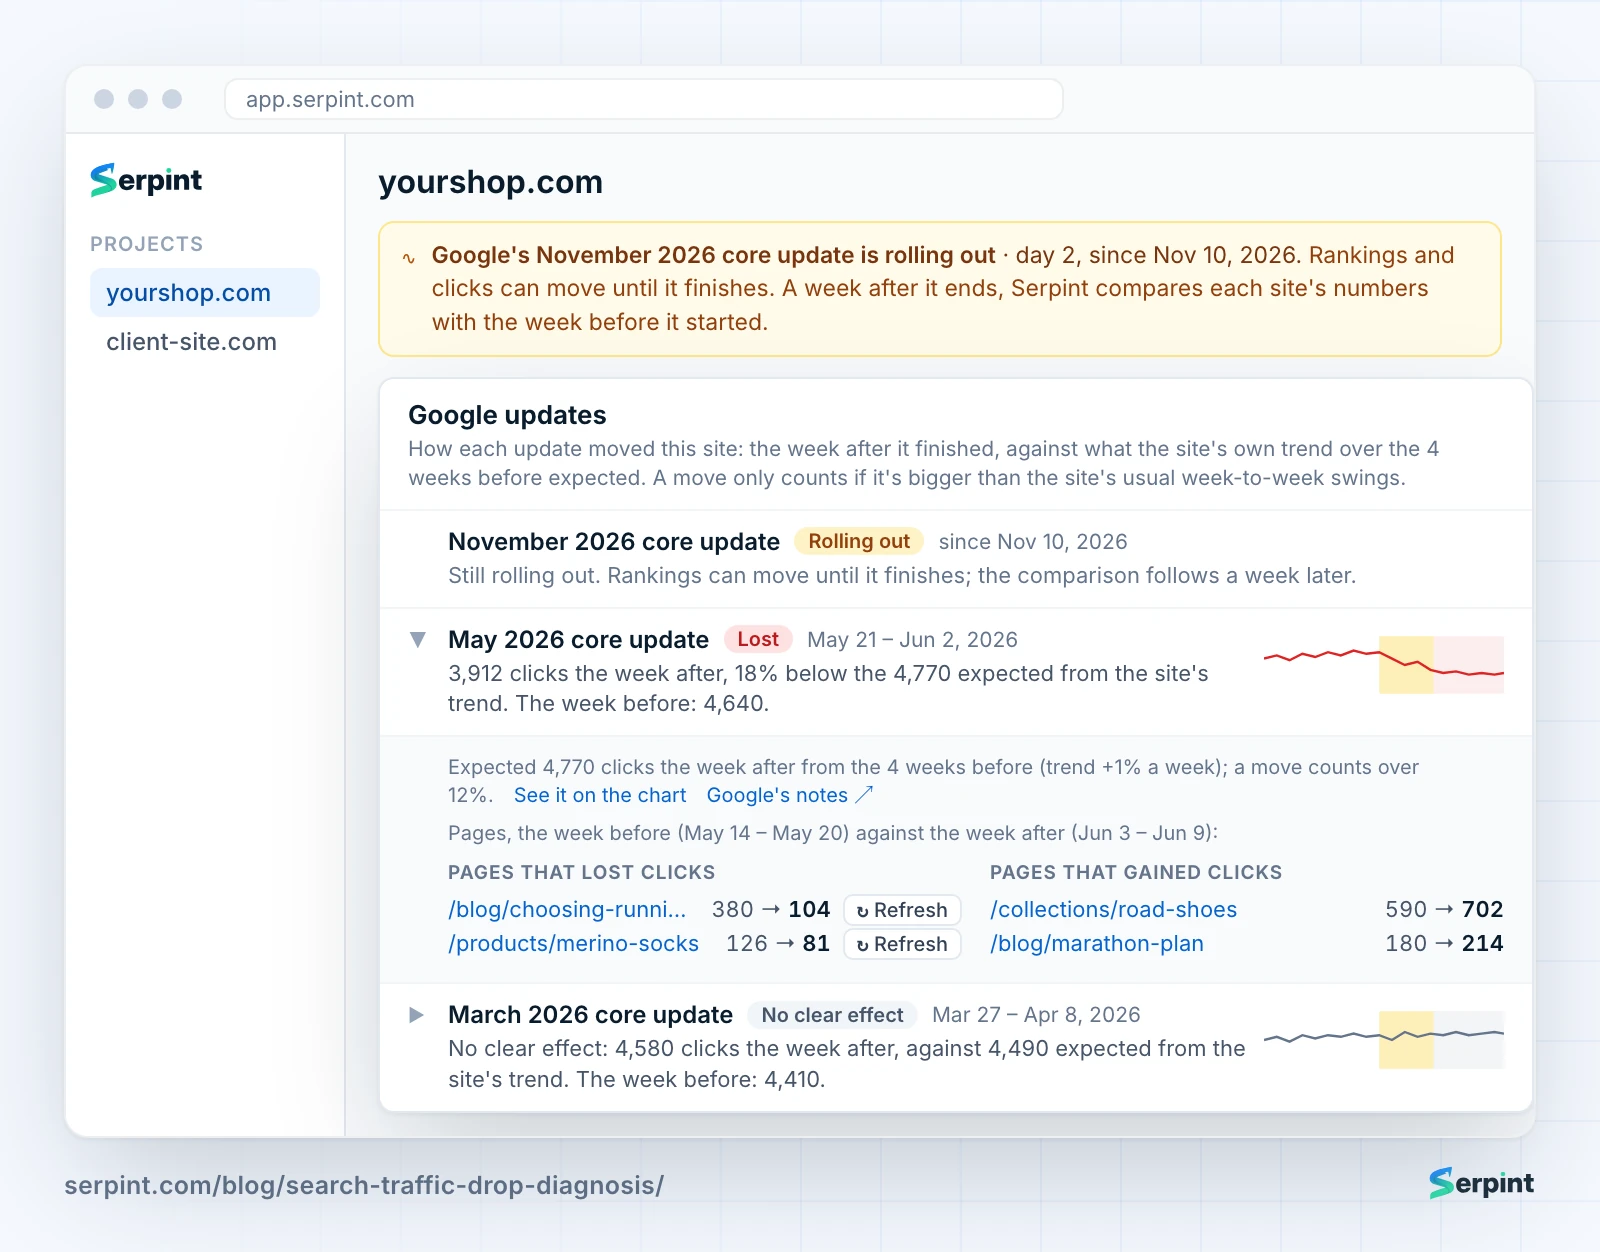
Every page you publish or refresh in Serpint is pinned on the chart too, with its clicks before and after. So a drop the week you rewrote a page shows up next to that change, not next to Google.
The checks are the same for every site, but the likely cause depends on what kind of site it is.
What does it mean for your kind of site?
Online stores should run check 2 first in November and December, since holiday demand rises and falls on its own. Expect overviews on buying searches too: 7 of 10 in our check had one. Product data and reviews on the page are what an overview can’t replace.
Affiliate and review sites are most exposed. 9 of 10 “best” searches in our check showed an overview, so check step 1 of winning clicks back every month. Your own tests, photos and comparison tables are the reason to click.
Publishers should split Web, Discover and News in check 4. Informational articles are where overviews take the most clicks, and Discover swings far more than web search.
Local businesses are the safest: none of the 10 “near me” searches in our check showed an overview, and all showed a map pack. The map pack is your battleground, so put the effort into your Business Profile and reviews before blog posts.
SaaS and B2B sites should group pages by intent in check 5. A drop in how-to articles rarely touches sign-ups; a drop on pricing or comparison pages does. Agencies can run the eight checks for every client and send the cause table as the report. Whatever the site, a few habits make a drop worse.
Which mistakes make a traffic drop worse?
Changing pages mid-rollout is the most common one. You can’t separate your edit’s effect from the update’s.
Deleting content is another. Google calls deletion a last resort: old doesn’t mean low quality, and short doesn’t mean thin.
Reading a single day is a third. Compare full weeks, and the same weeks last year. And skip quick fixes, like removing an element because someone online blamed it. Once you’ve fixed the real cause, you’ll want proof it worked.
How do you know a fix worked?
Give it time and compare like with like. Use full weeks, and measure against what your site’s own trend predicted rather than one good week.
Technical fixes show fastest: the Page indexing report recovers within days or weeks of Validate fix. New titles and descriptions show once Google recrawls the page, so watch the click rate from then. Quality work takes months, often until the next core update.
What should you do now?
If your traffic dropped this month, work through these in order:
- Compare GA4 with Search Console, and check Search Console’s data anomalies.
- Set Search Console to 16 months and compare with the same weeks last year.
- Check the Search Status Dashboard; if an update is rolling out, wait for it to finish.
- Compare clicks with impressions. If only clicks fell, find the searches that kept their position and lost their click rate.
- For those, check for an AI Overview, then work on being cited and on a reason to click.
- Find the pages, sections, countries and devices that lost the most.
- Check Page indexing, Crawl stats, Security issues and Manual actions, and fix what’s broken.
- Check whether people still search for what you lost.
- Only then decide whether it’s relevance, intent or quality, and keep a note of every change you make.
Founder of Serpint
Founder of Serpint. 6+ years in SEO and content marketing and 2 in GTM engineering, most recently as Head of Product and Content at lobstr.io, a B2B SaaS web scraping platform, until October 2026. Writes about SEO, AEO and GEO, the full stack of search and AI answer optimization, and content marketing.